

09 Dec Tracking COVID-19 Done by Cedarville University Data Analysts


A team of data analysts at Cedarville University is tracking how COVID-19 is progressing and are communicating the importance of data-driven recommendations.
Dr. Steven Gollmer, senior professor of physics and assistant chair to the department of science and mathematics, has been analyzing data science related to COVID-19 alongside fellow Cedarville University faculty members with the goal of discovering new insights pertaining to the virus.
 In addition to Gollmer, the team includes Mark Gathany, professor of biology; Ashley Holland, associate professor of mathematics; Tim Tuinstra, professor of electrical engineering; Patrick Dudenhofer, assistant professor of computer science and cyber operations; and John Delano, associate professor of information technology management.
When COVID-19 emerged this spring, Gollmer and his team knew that the statistics surrounding an infectious disease would provide them with a unique opportunity to apply data science to a relevant concern of society.
See the tracking visualization
“We began tracking down where the data was on the internet, downloading it, and then started using a stat package to analyze the preliminary data.” Gollmer said. “Then it was just a matter of, as COVID continued spreading, seeing if there were any patterns beyond what you’d expect.”
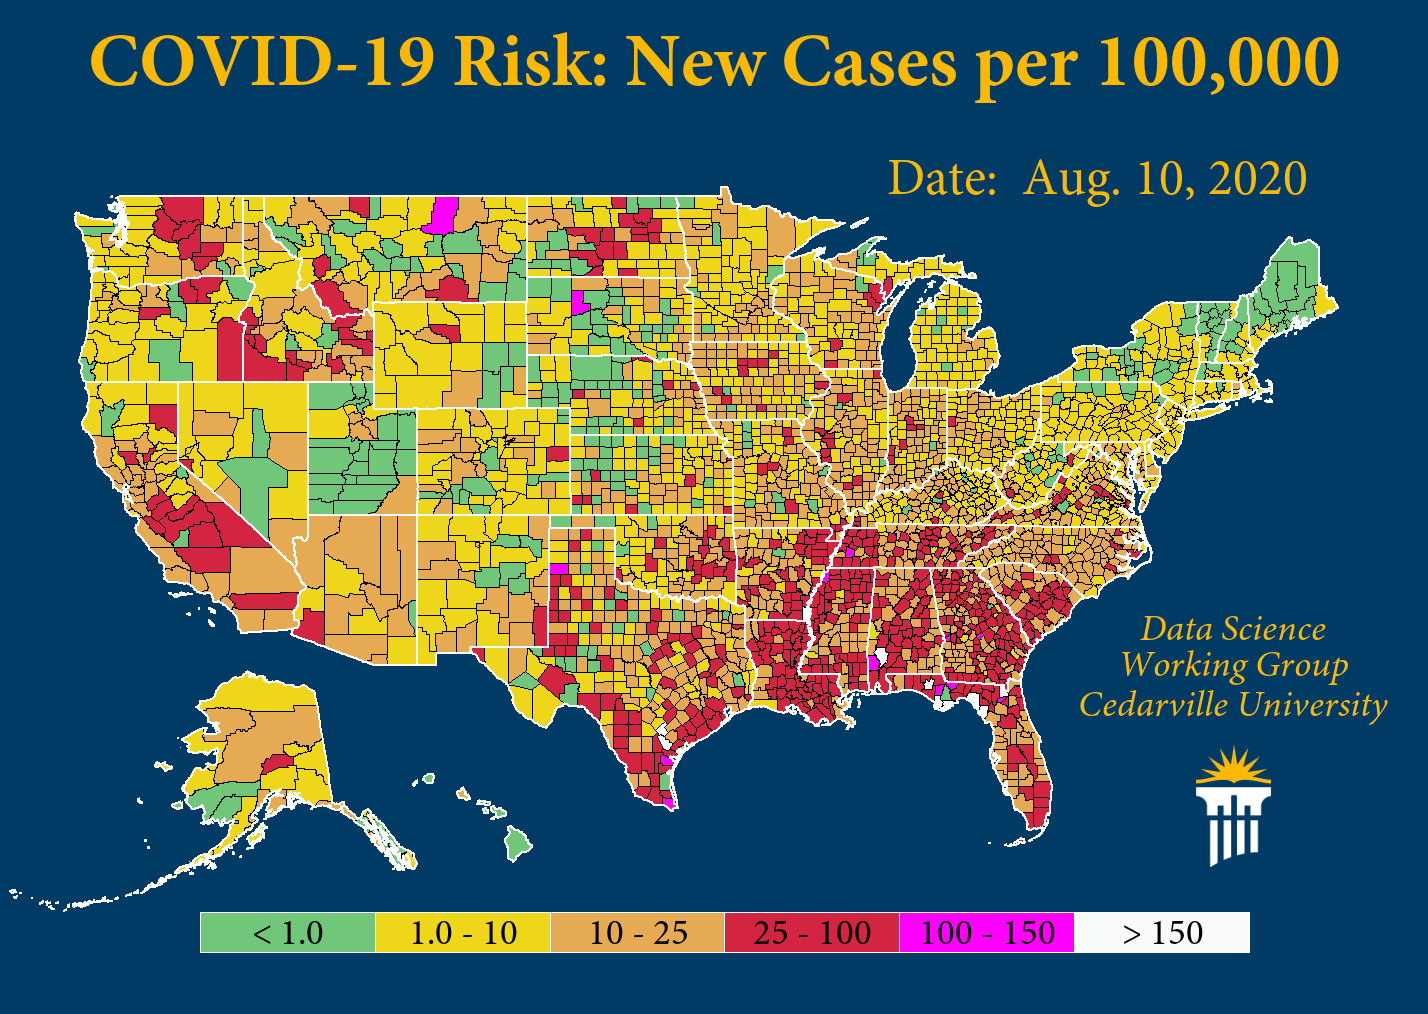
Based on current data, the team has produced visualizations that depict the spread of the virus. They believe that trends point to the effectiveness of wearing masks and practicing social distancing.
“We’ve described preventative measures kind of like swiss cheese, oddly enough,” Gollmer shared. “Swiss cheese has all of these holes in it, but if you put layers together, there are fewer holes of passage. While masks alone don’t ensure that you won’t contract COVID, adding additional measures, like social distancing, helps to reduce the chance of spread.”
The factor of human behavior has been a unique component of the team’s data analysis.
“We’re not just studying the spread of a disease amongst plants, but amongst people,” Gollmer added. “Humans react to their environments, and the more information we gain, the more people change their behaviors, which in turn changes the trends.”
As they’ve prepared presentations with their data science, the team has relied heavily on visuals to communicate their statistical findings.
“The messaging of data is important,” Gollmer noted. “It’s always been a concern in the scientific community how to accurately convey a message to those not as scientifically literate. We’re a visually based community, and a picture is worth a thousand words, so a visual graphic is going to linger in someone’s mind longer than a reasoned defense.”
They hope to combat the issues of inconsistent and incomplete data messaging as they present results from future analyses of the data.
“Both sides of any debate will argue that science is on their side, but it’s not just black and white simplicity — it’s usually in between,” Gollmer noted. “We all need to keep an open mind as we work to help reduce spread. This will end, but we need to be responsible to help the process.”
Located in southwest Ohio, Cedarville University is an accredited, Christ-centered, Baptist institution with an enrollment of 4,550 undergraduate, graduate and online students in more than 150 areas of study. Founded in 1887, Cedarville is recognized nationally for its authentic Christian community, rigorous academic programs, such as the Bachelor of Science in Physics program, strong graduation and retention rates, accredited professional and health science offerings and high student engagement ranking. For more information about the University, visit www.cedarville.edu.